
Google’s Lighthouse tool serves as an automated checklist for evaluating your website’s performance and user experience. Rather than manually inspecting your site, discover how to generate a comprehensive report in under a minute.
What Is Google Lighthouse?
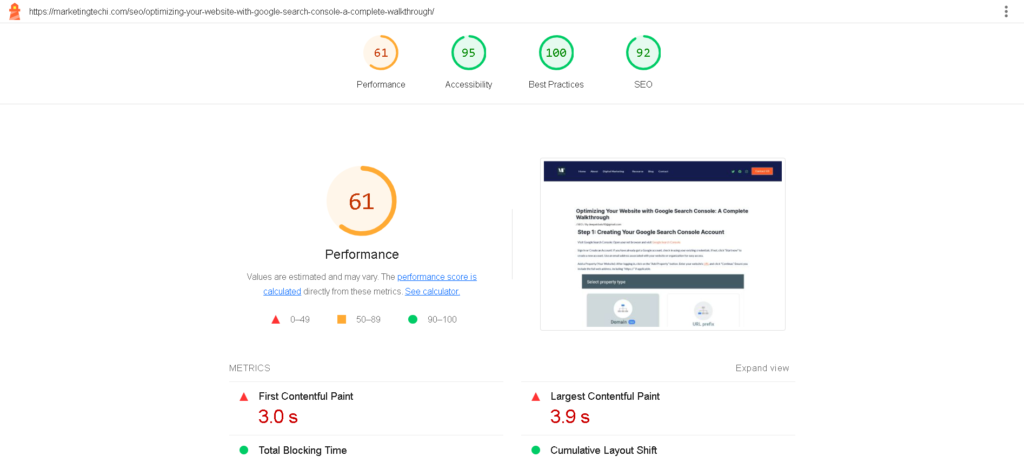
Lighthouse stands as an automated website analysis tool that scrutinizes your website and rates it in four critical categories:
Performance: Measures website speed and responsiveness.
Accessibility: Checks for issues affecting users with disabilities.
Best Practices: Assesses adherence to web development standards.
SEO: Evaluates search engine optimization elements.
Each category receives a score ranging from 0 to 100, with 100 signifying perfection. These scores are determined through individual checklist items called Lighthouse audits. Additionally, there’s a Progressive Web App (PWA) section examining features that enhance your website’s mobile app-like behavior.
Running your website through Lighthouse aids in ensuring speed, accessibility, and SEO improvements.
PageSpeed Insights Vs. Lighthouse: What Sets Them Apart?
Lighthouse, developed by Google and with publicly available source code, powers PageSpeed Insights and various other tools. You can also install Lighthouse directly on your computer. While the basic Lighthouse report only covers automated speed tests, PageSpeed Insights offer both real user data and Lighthouse test results.
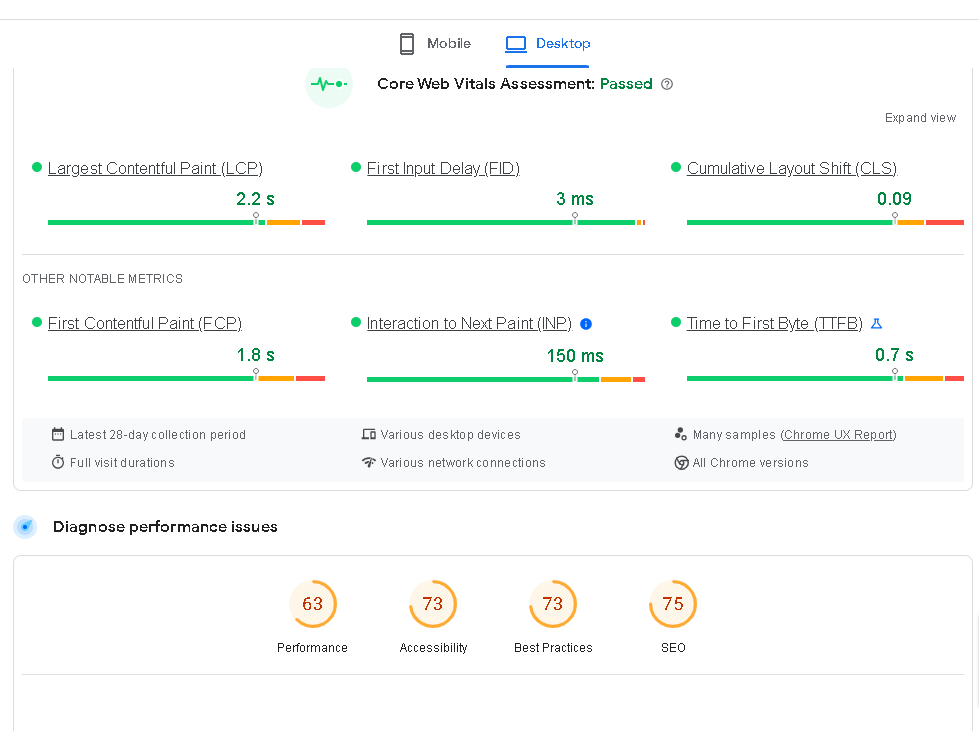
Although the Lighthouse Performance score doesn’t directly impact SEO, it offers insights to enhance page speed—a critical ranking signal. Google considers Core Web Vitals (CWV), gathered from real Chrome users, for SEO rankings. Lighthouse data, simulated for performance tests, can still guide improvements.
How to Test Your Website Speed With Lighthouse
The easiest way to run a Lighthouse test is through online tools like Google PageSpeed Insights. Follow these steps:

Enter Your URL: Input your website URL.
Get Real User Data & Lighthouse Test Results: PageSpeed Insights provides both real user data and Lighthouse test results, offering a comprehensive view.
Aim for All Green Scores: Strive for a Lighthouse Performance score above 90 for optimal results.
Consider running Lighthouse tests on both mobile and desktop configurations, as they impact various aspects of your website’s performance.
How Is the Lighthouse Performance Score Calculated?
The Lighthouse Performance score derives from five performance metrics, each contributing differently:
Total Blocking Time (30%)
Largest Contentful Paint (25%)
Cumulative Layout Shift (25%)
First Contentful Paint (10%)
Speed Index (10%)
Each metric has a subscore, combined according to these weights to calculate the overall score.
You can access a detailed breakdown of your Lighthouse Performance score by clicking the “See Calculator” link in the Lighthouse report.

Running a Lighthouse Test in Chrome DevTools
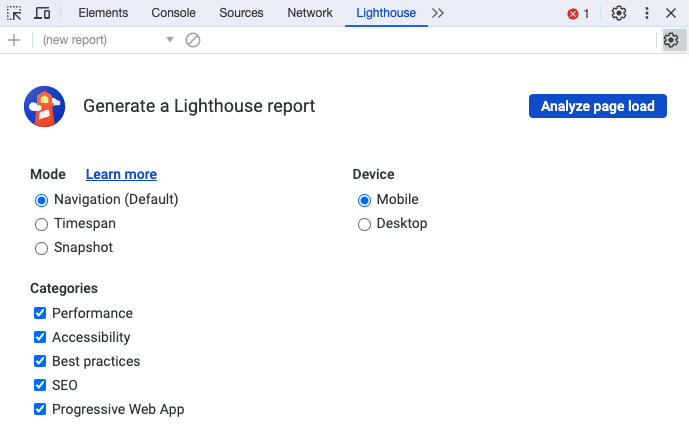
You can also use Chrome DevTools to run a Lighthouse test. This is especially useful for testing local servers, login-required pages, or user interactions during speed tests. Here’s how:
Open the desired website.
Right-click and select “Inspect.”
Navigate to the “Lighthouse” tab.
Click “Analyze page load” for quick results.
DevTools offer different modes, including Navigation, Timespan, and Snapshot, catering to various testing needs. However, for the most reliable data, it’s recommended to use dedicated page speed tools.
Is Google Lighthouse Data Reliable?
Lighthouse provides varied results depending on the operating mode used. PageSpeed Insights relies on simulated throttling, which may occasionally yield inaccurate data. To obtain more reliable data, consider using our SEO Analyzer, as it collects metrics directly in a throttled environment.
Improving Your Lighthouse Performance Score
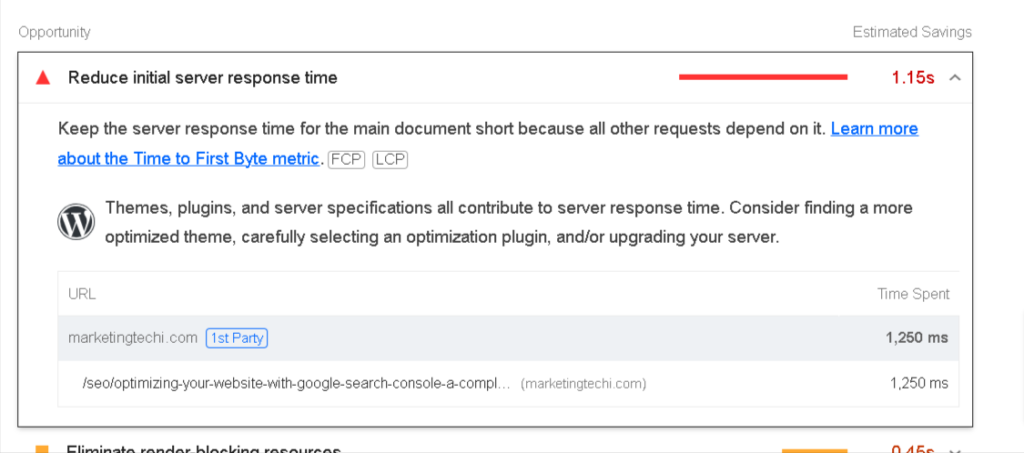
To enhance your Lighthouse Performance score, consult the opportunities section within the Lighthouse performance category. It automatically identifies potential improvements and estimates their impact on page load time. Analyzing a waterfall visualization can also provide valuable insights into your website’s bottlenecks.
In some cases, you can improve scores by eliminating unnecessary third-party code or reconfiguring your website theme. However, for custom-built websites, collaborating with your development team may be necessary for implementing fixes.
Should You Be Concerned About a Low Lighthouse Score?
If your real visitor metrics are satisfactory, you won’t incur penalties from Google. Nevertheless, optimizing your site further can offer a better experience to users with slower mobile devices and poorer internet connections.
Google Lighthouse Troubleshooting
Occasionally, discrepancies between Lighthouse tests and Core Web Vitals (CWV) tests may arise. Lighthouse metrics might appear worse than real user data due to various factors like network conditions, content variability, and background activities. These differences between runs are expected, as no two page loads are identical.
In summary, Google’s Lighthouse tool is a valuable resource for optimizing your website’s performance and user experience. By understanding its metrics and using it effectively, you can enhance your website’s speed, accessibility, and SEO, ultimately providing a better online experience for your users.